Atmospheric Forcing Domain
Comparison of the GoMSS NEMO model domain from
GoMSS-NEMO-config/bathy_meter.nc and Environment Canada GEM 2.5km
resolution HRDPS research model sub-domain from
http://collaboration.cmc.ec.gc.ca/science/outgoing/dominik.jacques/meopar_east/.
In [2]:
import matplotlib.cm
import matplotlib.pyplot as plt
import numpy as np
import seaborn as sns
import xarray as xr
In [4]:
%matplotlib inline
NEMO Model Domain
In [5]:
bathy = xr.open_dataset('../../GoMSS-NEMO-config/bathy_meter.nc')
In [6]:
bathy
Out[6]:
<xarray.Dataset>
Dimensions:     (x: 668, y: 218)
Coordinates:
  * x           (x) int64 0 1 2 3 4 5 6 7 8 9 10 11 12 13 14 15 16 17 18 19 ...
  * y           (y) int64 0 1 2 3 4 5 6 7 8 9 10 11 12 13 14 15 16 17 18 19 ...
Data variables:
    X           (x) float64 1.0 2.0 3.0 4.0 5.0 6.0 7.0 8.0 9.0 10.0 11.0 ...
    Y           (y) float64 1.0 2.0 3.0 4.0 5.0 6.0 7.0 8.0 9.0 10.0 11.0 ...
    nav_lon     (y, x) float64 -68.37 -68.34 -68.32 -68.29 -68.27 -68.24 ...
    nav_lat     (y, x) float64 37.57 37.58 37.59 37.59 37.6 37.61 37.62 ...
    Bathymetry  (y, x) float64 4e+03 4e+03 4e+03 4e+03 4e+03 4e+03 4e+03 ...
Attributes:
    Bathymetry: Etopov1v_bathymetry
In [7]:
fig, ax = plt.subplots(1, 1, figsize=(14, 8))
cmap = matplotlib.cm.get_cmap('viridis_r')
cmap.set_bad('burlywood')
mesh = ax.pcolormesh(
    bathy.nav_lon, bathy.nav_lat,
    np.ma.masked_values(bathy.Bathymetry, 0),
    cmap=cmap,
)
cbar = fig.colorbar(mesh, ax=ax)
cbar.set_label('Depth [m]')
ax.set_aspect(
    1 / np.cos(np.median(bathy.nav_lat) * np.pi / 180),
    adjustable='box-forced',
)
ax.set_xlabel('Longitude [°E]')
ax.set_xlim(-71.5, -51)
ax.set_ylabel('Latitude [°N]')
ax.set_ylim(37.5, 48)
ax.grid(axis='both')
plt.tight_layout()

EC HRDPS Research Model Domain
In [8]:
atmos = xr.open_dataset('../../2016072700_012_2.5km_534x684.nc')
In [9]:
atmos
Out[9]:
<xarray.Dataset>
Dimensions:       (time_counter: 1, x: 534, y: 684)
Coordinates:
  * time_counter  (time_counter) datetime64[ns] 2016-07-27T12:00:00
  * x             (x) int64 0 1 2 3 4 5 6 7 8 9 10 11 12 13 14 15 16 17 18 ...
  * y             (y) int64 0 1 2 3 4 5 6 7 8 9 10 11 12 13 14 15 16 17 18 ...
Data variables:
    nav_lon       (y, x) float32 285.263 285.289 285.314 285.339 285.364 ...
    nav_lat       (y, x) float32 40.6528 40.6412 40.6295 40.6178 40.6061 ...
    tair          (time_counter, y, x) float64 296.3 296.4 296.6 296.5 296.3 ...
    qair          (time_counter, y, x) float64 0.01233 0.01243 0.01255 ...
    seapres       (time_counter, y, x) float64 1.015e+05 1.015e+05 1.015e+05 ...
    precip        (time_counter, y, x) float64 0.0 0.0 0.0 0.0 0.0 0.0 0.0 ...
    therm_rad     (time_counter, y, x) float64 356.6 357.3 358.2 357.4 357.2 ...
    solar         (time_counter, y, x) float64 322.6 322.7 322.9 323.2 323.3 ...
Attributes:
    history: Wed Jul 27 08:14:44 2016: ncks -A /cnfs/dev/mrb2/arma/armadja/MEOPAR/ocean/tmp//FB_2016072700_012_534x684.nc /cnfs/dev/mrb2/arma/armadja/MEOPAR/ocean/tmp//2016072700_012_2.5km_534x684.nc
Wed Jul 27 08:14:43 2016: ncks -A /cnfs/dev/mrb2/arma/armadja/MEOPAR/ocean/tmp//FI_2016072700_012_534x684.nc /cnfs/dev/mrb2/arma/armadja/MEOPAR/ocean/tmp//2016072700_012_2.5km_534x684.nc
Wed Jul 27 08:14:43 2016: ncks -A /cnfs/dev/mrb2/arma/armadja/MEOPAR/ocean/tmp//PR_2016072700_012_534x684.nc /cnfs/dev/mrb2...
    NCO: 4.0.8
In [10]:
fig, ax = plt.subplots(1, 1, figsize=(14, 8))
mesh = ax.pcolormesh(
    atmos.nav_lon, atmos.nav_lat,
    np.ma.masked_values(atmos.tair[0, ...], 0),
    cmap='viridis',
)
cbar = fig.colorbar(mesh, ax=ax)
cbar.set_label('2m Air Temperature [K]')
ax.set_aspect(
    1 / np.cos(np.median(atmos.nav_lat) * np.pi / 180),
    adjustable='box-forced',
)
ax.set_xlabel('Longitude [°E]')
ax.set_xlim(285, 312)
ax.set_ylabel('Latitude [°N]')
ax.set_ylim(33.6, 53.2)
ax.grid(axis='both')
plt.tight_layout()
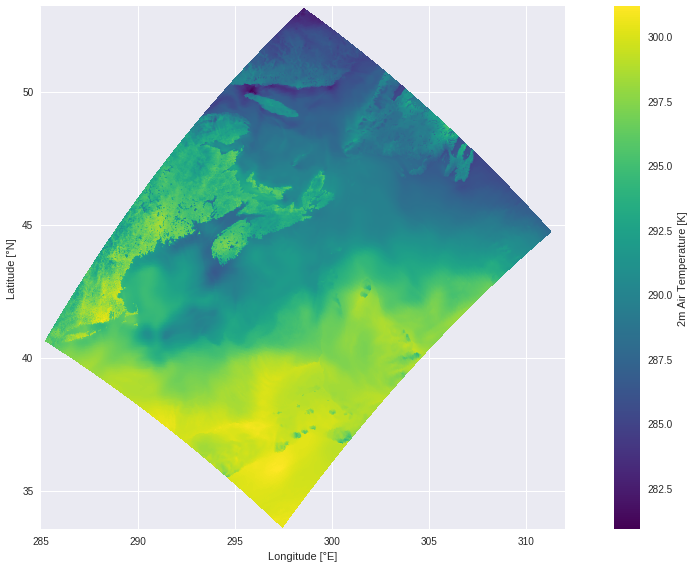
So, the EC HRDPS domain clearly includes the GoMSS NEMO domain
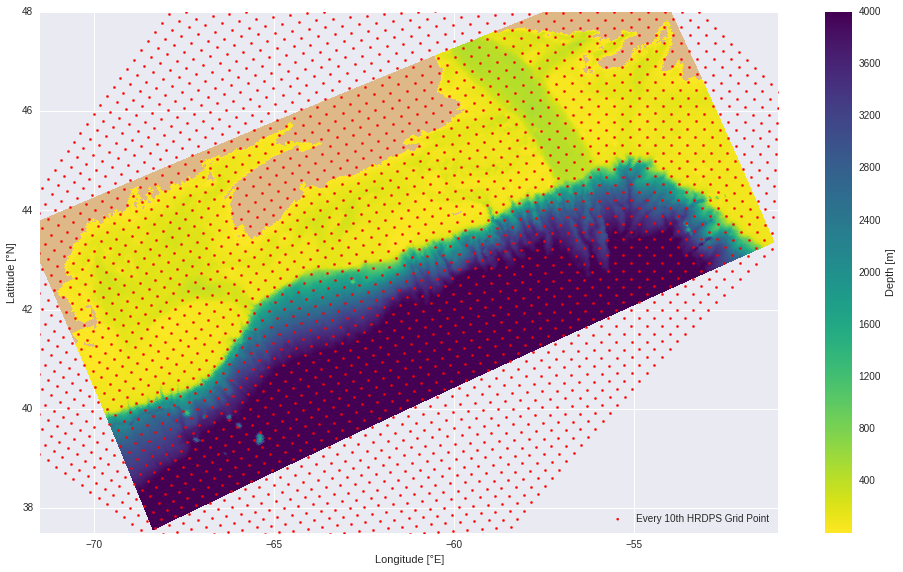
HRDPS Grid Points on GoMSS NEMO Domain
In [11]:
fig, ax = plt.subplots(1, 1, figsize=(14, 8))
cmap = matplotlib.cm.get_cmap('viridis_r')
cmap.set_bad('burlywood')
mesh = ax.pcolormesh(
    bathy.nav_lon, bathy.nav_lat,
    np.ma.masked_values(bathy.Bathymetry, 0),
    cmap=cmap,
)
cbar = fig.colorbar(mesh, ax=ax)
cbar.set_label('Depth [m]')
ax.scatter(
    (atmos.nav_lon-360)[::10, ::10], atmos.nav_lat[::10, ::10],
    marker='.', color='red',
    label='Every 10th HRDPS Grid Point',
)
ax.set_aspect(
    1 / np.cos(np.median(bathy.nav_lat) * np.pi / 180),
    adjustable='box-forced',
)
ax.legend(loc='lower right', numpoints=1)
ax.set_xlabel('Longitude [°E]')
ax.set_xlim(-71.5, -51)
ax.set_ylabel('Latitude [°N]')
ax.set_ylim(37.5, 48)
ax.grid(axis='both')
plt.tight_layout()